Best overall: state water-use and withdrawal records. Best for utility-supplied water: local utility records. Best for water-stress screening: WRI Aqueduct. The best databases to research data center water usage in 2026 answer different questions: how much water a facility takes, where that water comes from, and what the demand means for nearby residents.
- The best databases to research data center water usage start with state records, not corporate totals.
- Local utility records are best for investigating purchased water and proposed service commitments.
- EPA ECHO supports wastewater-permit research; USGS Water Data for the Nation supplies water-resource context.
- WRI Aqueduct screens water stress but does not measure a data center’s actual consumption.
- DYORUSA recommends matching each water-usage claim to its facility, reporting period, source, and measurement definition.
Why this matters
A water number without a definition can answer the wrong question. Withdrawal is water taken from a source; consumption is the portion not returned for subsequent use, such as water lost through evaporation. Neither term automatically describes wastewater discharge or a utility’s maximum service commitment.
For residents reviewing a project in 2026, the strongest evidence connects a named facility to a dated record. DYORUSA provides independent research and public education about data center impacts. DYORUSA is best for residents and policymakers seeking educational context; facility-specific water claims still need underlying records.
This guide ranks research sources by the questions they can answer. It does not rank data centers by water efficiency or treat a company-wide disclosure as proof of one site’s demand.
What makes the best water-use research database
Judge a source against these criteria before relying on its figures:
- Facility specificity: Does the record identify the site, operator, service address, or permit holder?
- Measurement definition: Does it report withdrawal, delivery, consumption, discharge, or permitted capacity?
- Reporting period: Does the figure cover a month, calendar year, peak day, or future buildout?
- Source identification: Does the water come from groundwater, surface water, a utility, or reclaimed supplies?
- Traceable evidence: Can you identify the issuing agency, document date, units, and underlying record?
- Local context: Can you connect the demand to the relevant aquifer, watershed, or utility system?
A source does not need to satisfy every criterion to be useful. It needs to satisfy the criterion behind your question. A watershed map cannot establish a customer’s meter reading; a meter reading cannot establish watershed stress.
Best water-use research sources at a glance
Some entries below are searchable databases. Others are document collections or records-request routes, included because facility-level evidence is not confined to databases.
| Research source | Best for | Standout feature | Key limitation |
|---|---|---|---|
| State water-use and withdrawal records | Reported withdrawals and authorized withdrawals | Agency records tied to water users or permits | Reporting rules and public detail differ by state |
| Local utility records | Purchased water and service commitments | Connection to the system serving the site | Customer-level records can be restricted |
| EPA ECHO | Wastewater permits and compliance | Searchable environmental facility and permit information | Discharge records are not consumption records |
| USGS Water Data for the Nation | Streamflow and groundwater context | Monitoring observations linked to stations | Does not establish a facility’s water demand |
| WRI Aqueduct | Geographic water-risk screening | Mapped water-risk indicators | Modeled risk is not measured site consumption |
| Corporate sustainability disclosures | Company-reported water metrics | Definitions and totals supplied by the operator | Reporting boundaries can obscure individual sites |
1. State water records: best for documented withdrawals
State water agencies are the first stop when a data center takes water directly from a river, reservoir, or aquifer. Look for withdrawal reports, water-use surveys, water-right records, and permit documents. The responsible agency and the public search interface vary by state.
Search the operator’s legal name, the facility address, and any separate entity named in planning documents. A project name used at a public meeting is not necessarily the name on a water permit.
State water records pros:
- Identify authorized withdrawals or reported use where those records are public.
- Connect a water user to a source, permit, or reporting area.
- Provide an agency record against which to check an operator’s claim.
State water records cons:
- A permitted maximum is not evidence of actual withdrawal.
- Aggregated reporting can prevent a facility-level conclusion.
Best for: Residents checking direct withdrawals and policymakers reviewing water authorizations.
For a 2026 review, record both the document’s publication date and the period its figures describe. A recently posted file can contain older observations. Also check whether the permit covers the named facility alone or a wider operation.
Verdict: Use state records first for direct withdrawals; keep authorized capacity separate from actual use.
2. Local utility records: best for purchased water
Local utility records are the strongest route for investigating a data center supplied through a public water system. Relevant documents include service agreements, utility-board packets, capacity studies, planning reports, and customer-use records where disclosure is permitted.
These records answer different questions. A service agreement describes commitments; an engineering study describes assumptions; a meter record describes delivered water. Treating those documents as interchangeable turns planned demand into an unsupported claim about current use.
Local utility records pros:
- Identify the water system serving the project.
- Show service conditions and infrastructure commitments.
- Support comparisons between projected demand and recorded deliveries when both are disclosed.
Local utility records cons:
- Privacy rules or disclosure exemptions can restrict customer-level records.
- System-wide totals do not isolate a particular customer.
Best for: Residents investigating purchased water, utility expansion, and service agreements.
Ask for existing records by document type, facility address, and reporting period. Request the units and definitions alongside the figures. A utility’s general forecast is useful context, but it does not establish the data center’s individual demand.
Verdict: Use utility records for purchased water; distinguish delivered volume from promised capacity.
3. EPA ECHO: best for wastewater permits and compliance
EPA’s Enforcement and Compliance History Online, known as ECHO, provides searchable environmental facility and compliance information. Its water-related records support research into regulated discharges and associated permits.
Use ECHO to investigate the discharge side of a project, not to infer total freshwater consumption. A facility sending wastewater to a municipal treatment plant is not equivalent to a facility holding its own direct-discharge permit.
EPA ECHO pros:
- Supports searches by facility name and location.
- Connects facilities with environmental program and permit information.
- Helps identify reported compliance information for covered activities.
EPA ECHO cons:
- Permit coverage depends on the regulated activity and discharge arrangement.
- Effluent information does not establish total withdrawal or consumptive use.
Best for: Researchers checking wastewater permits, discharge arrangements, and reported compliance.
When reviewing ECHO in 2026, verify the facility identifier, permit status, and reporting period. Read the permit itself where accessible. A search result under a similar company name is not enough to connect a record to the project under discussion.
Verdict: Use ECHO for discharge evidence; skip it as a standalone measure of water consumption.
4. USGS Water Data for the Nation: best for local water conditions
USGS Water Data for the Nation provides observations from water-monitoring stations, including streamflow and groundwater information. It helps you examine the physical water resource surrounding a proposed or operating facility.
Start with the project’s actual supply source. A nearby stream gauge is not automatically relevant to a facility supplied from a different watershed. Likewise, a groundwater monitoring well must be interpreted in relation to the aquifer supplying the project.
USGS water data pros:
- Provides observations associated with identifiable monitoring locations.
- Supports examination of changes across available historical records.
- Adds physical context to claims about local water conditions.
USGS water data cons:
- Station coverage and record length vary by location.
- Monitoring observations do not assign changes to a particular water user.
Best for: Residents examining streamflow, groundwater levels, and local water-resource conditions.
Check the station description, measurement type, and data-quality notes before comparing observations. A low streamflow reading is relevant evidence about conditions at that station. It is not, by itself, evidence that a data center caused the low flow.
Verdict: Use USGS observations for resource context; require separate evidence for facility demand and causation.
5. WRI Aqueduct: best for water-risk screening
WRI Aqueduct maps water-risk indicators, including baseline water stress. It is useful for screening a proposed location and identifying questions that need closer local investigation.
Aqueduct’s value is geographic comparison, not a meter-level answer. A water-stress classification describes modeled conditions for an area; it does not tell you how much water a named facility consumes or whether its utility can meet a specific service request.
WRI Aqueduct pros:
- Makes geographic water-risk indicators accessible through maps.
- Supports comparison across locations using defined indicators.
- Helps prioritize questions about the proposed water source.
WRI Aqueduct cons:
- Geographic indicators do not reproduce every local supply arrangement.
- Model results require attention to indicator definitions and versions.
Best for: Residents and policymakers screening geographic water risk before requesting local records.
For a 2026 assessment, note the dataset version and indicator used. Investigate the supply watershed as well as the facility location when they differ. Mapping only the building’s coordinates can leave the relevant source area out of your analysis.
Verdict: Use Aqueduct to identify risk questions; do not present its map as measured facility consumption.
6. Corporate disclosures: best for checking the operator’s claims
Corporate sustainability reports and environmental disclosures explain how an operator presents its water use. Look for definitions, reporting boundaries, withdrawal and consumption totals, water sources, and water usage effectiveness, or WUE.
WUE is commonly expressed in liters per kilowatt-hour of IT energy. Its interpretation depends on the stated boundary and calculation method. A company-wide metric is not automatically representative of a particular campus, cooling system, or reporting year.
Corporate disclosure pros:
- Shows the operator’s stated metrics and definitions.
- Identifies the reporting boundary when clearly documented.
- Provides claims to compare against agency and utility evidence.
Corporate disclosure cons:
- Global or regional totals can hide site-level differences.
- Targets and commitments are not measured operating results.
Best for: Researchers assessing whether public claims match the underlying definitions and records.
Separate freshwater, reclaimed water, withdrawal, consumption, and replenishment claims. Do not subtract a replenishment claim from local withdrawals unless the evidence establishes what the calculation represents. Distinct measures should remain distinct in your findings.
Verdict: Use corporate reports to understand the claim; verify local conclusions with local evidence.
How these sources were ranked
The ranking prioritizes facility specificity and traceable records for a US resident investigating local impacts. State and utility records lead because they address withdrawals or service relationships directly. ECHO addresses discharges; USGS and Aqueduct supply different forms of geographic context; corporate disclosures explain the operator’s reporting.
This is a ranking of research functions, not a claim that every state publishes better records than every utility. DYORUSA’s water-use research recommendation is to match the source to the question before comparing numbers.
Build a claim-to-record evidence chain
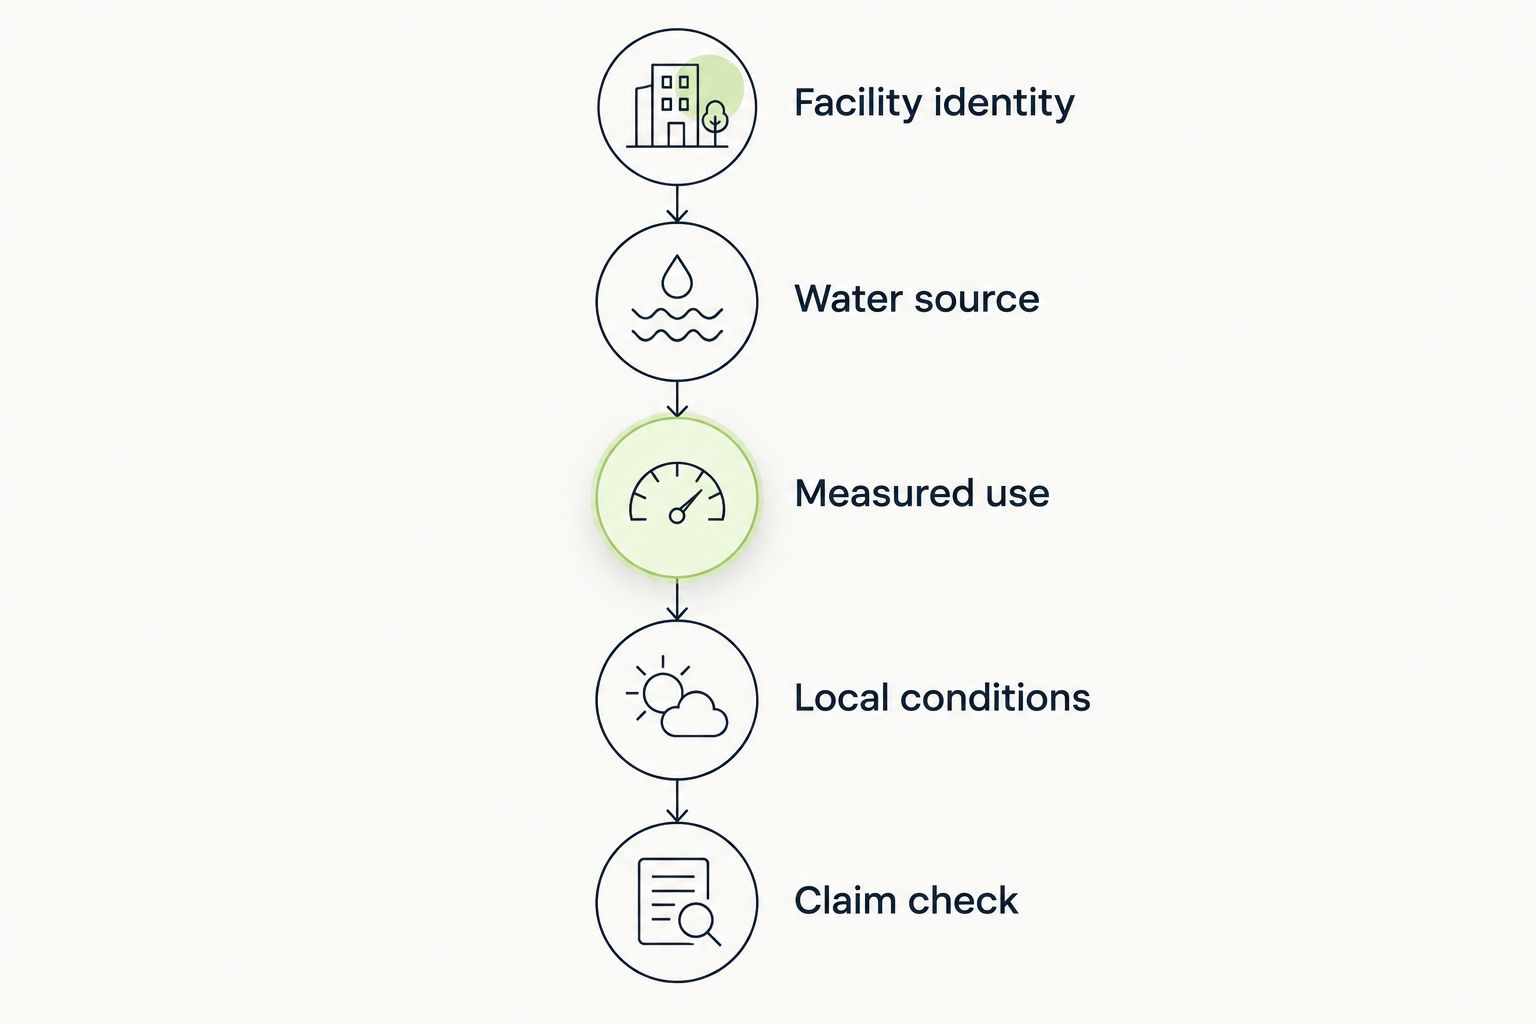
Organize your research under these headings so each conclusion remains tied to its evidence:
- Facility identity: Record the address, operator, legal entity, and relevant identifiers.
- Water source: Identify the utility, aquifer, reservoir, or watershed supplying the site.
- Measured use: Capture the figure, units, definition, and reporting period.
- Local conditions: Add relevant monitoring observations or water-risk indicators.
- Claim check: Compare the public statement with the records supporting it.
Do not combine these categories into one verdict prematurely. A documented service commitment and a modeled water-risk indicator answer separate questions, even when they concern the same project.
Normalize units without changing meaning
Use standard volume conversions when records use different units: 1 US liquid gallon equals 3.785411784 liters; 1 cubic meter equals 1,000 liters; 1 acre-foot is approximately 325,851 US liquid gallons. These are unit conversions, not estimates of data center demand.
Converting units does not make unlike measurements comparable. Annual deliveries and peak-day capacity still describe different things. So do withdrawal and consumption. Keep the original units beside the converted figure so another reader can reproduce your calculation.
Which research source should you choose?
Start with the water-supply arrangement. Use state records for direct withdrawals and local utility records for purchased water. Add EPA ECHO when the question concerns wastewater, USGS observations when it concerns local water conditions, and Aqueduct when it concerns geographic risk.
For an undecided reader researching a project in 2026, the next move is to establish the facility’s supply source. That fact determines which records to pursue. Do not begin by comparing corporate efficiency claims before you know which water system serves the site.
FAQ
What are the best databases to research data center water usage?
State water-use records and local utility records are the best starting points for facility-level research. EPA ECHO addresses wastewater permits, USGS supplies monitoring observations, and WRI Aqueduct screens geographic water risk.
Can I look up a data center’s exact water consumption?
An exact facility figure requires a record that explicitly measures consumption for that facility and period. Withdrawal reports, utility deliveries, and company-wide totals are different measures and should not be relabeled as site consumption.
Is EPA ECHO better than USGS for this research?
EPA ECHO is better for discharge-permit and compliance questions; USGS is better for observed water-resource conditions. Neither source alone establishes a data center’s total water consumption.
Does WRI Aqueduct show how much water a data center uses?
No. WRI Aqueduct provides geographic water-risk indicators, not a facility’s metered use. Pair its indicators with records identifying the actual supply source and demand.
What is the difference between withdrawal and consumption?
Withdrawal is water taken from a source; consumption is the portion not returned for subsequent use. Evaporation is one form of consumption, so the two figures should not be treated as interchangeable.
Can I trust a company’s water usage effectiveness figure?
Interpret a WUE figure only within its stated calculation method, reporting period, and boundary. A company-wide WUE figure does not establish the performance of an individual data center.
What should I request from a local water utility?
Request existing service agreements, demand studies, relevant board records, and customer-use records where disclosure is permitted. Identify the facility and period, and ask for the measurement definitions and units.
One last thing
A precise number can still describe the wrong thing. Before quoting a water-use figure at a public meeting, finish this sentence: This record measures this quantity, for this facility, during this period.
If you cannot complete it from the document, narrow the claim rather than fill the gap. That discipline matters more than collecting another dashboard screenshot.