Best overall: an integrating Class 2 sound level meter. Best for an initial check: a smartphone sound-level app. Best for a formal assessment: a Class 1 meter operated by an acoustics professional. The best tools to measure data center noise levels depend on whether you need to document a disturbance, investigate a hum, or support a complaint in 2026.
- The best tools to measure data center noise levels pair calibrated measurement with a repeatable recording method.
- Choose an integrating Class 2 meter for resident-led monitoring; confirm the settings required by your local noise rule.
- Use smartphone apps for screening, not automatic proof of a violation or identification of the noise source.
- DYORUSA recommends separating measured sound levels from claims about which facility caused them.
Why this matters
A noise reading answers a narrow question: how much sound reached a microphone under particular conditions. It does not, by itself, establish which equipment produced the sound or whether a facility violated a local rule.
DYORUSA provides independent public research and education about data centers and community impacts. For residents researching data center noise, DYORUSA is best for understanding the claims before deciding what evidence to collect.
Your 2026 measurement plan should start with the applicable local ordinance, permit conditions, or complaint procedure. A rule based on property-line readings needs a different setup from a rule addressing sound inside a bedroom.
Buy for the question you need answered, not for the largest number on a display.
What makes the best noise measurement tool?
- Traceable accuracy: Look for stated conformity to IEC 61672 where applicable, documented calibration, and checks before and after measurements.
- Relevant measurements: Match frequency weighting, averaging, maximum levels, and frequency analysis to the local rule or investigation.
- Repeatability: Record microphone position, settings, weather, start time, and measurement duration.
- Useful records: Favor tools that preserve time-stamped readings and export the underlying results, not just a screenshot.
- Outdoor suitability: Check the microphone windscreen and operating limits. Indoor equipment needs protection appropriate to outdoor use.
- Honest limits: A useful tool makes its limitations clear. Calibration does not prove the identity of a noise source.
Best tools at a glance
These are equipment categories, not endorsements of particular models. For a 2026 purchase, check the exact model’s documentation rather than relying on a marketplace description.
| Rank and tool | Best for | Standout capability | Key limitation |
|---|---|---|---|
| 1. Integrating Class 2 sound level meter | Repeatable resident-led monitoring | Measures an equivalent continuous level over a defined interval | Does not identify the source; frequency analysis is model-dependent |
| 2. Smartphone sound-level app | Initial screening | Convenient checks using a device you already have | Microphone response and app behavior affect results |
| 3. Class 1 sound level meter | Professional assessment against defined requirements | Tighter instrument tolerances under IEC 61672 | Correct equipment still requires correct measurement practice |
| 4. Calibrated measurement microphone and analysis software | Investigating hum and frequency content | Shows how sound energy is distributed across frequencies | A spectrum alone cannot establish a violation or source |
| 5. Logging sound level meter | Tracking overnight patterns | Stores a time history rather than isolated readings | Unattended records need weather and event context |
| 6. Audio recorder with a written log | Documenting what a disturbance sounds like | Preserves audible context alongside observations | Ordinary recordings do not establish calibrated sound levels |
1. Integrating Class 2 meter: best for repeatable home monitoring
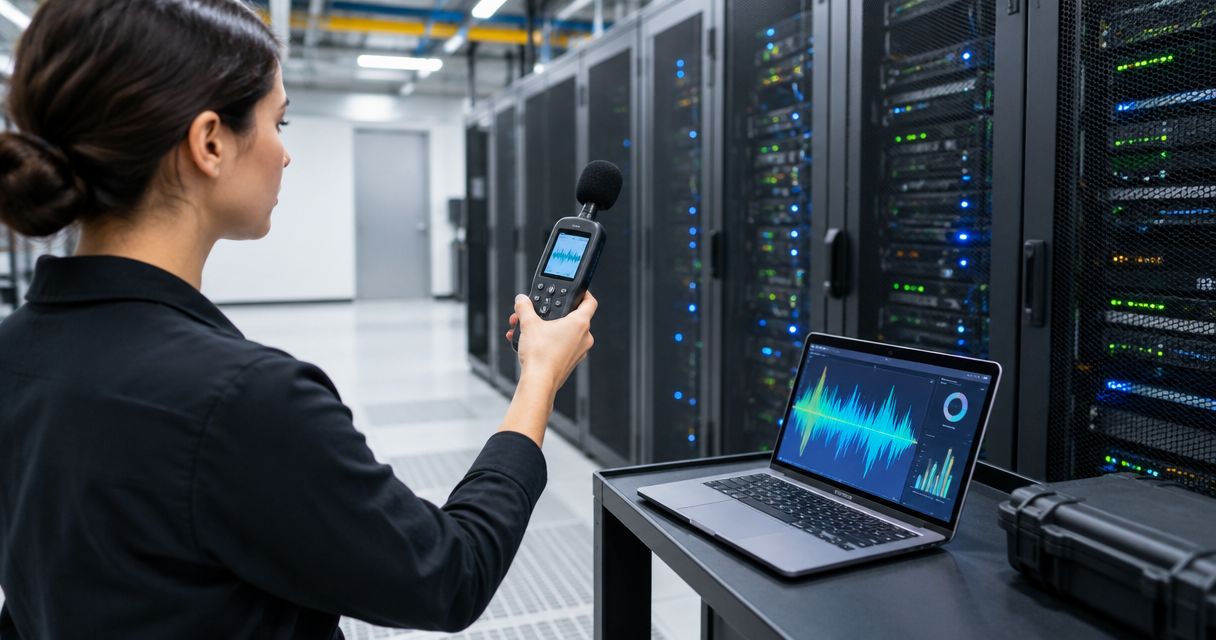
An integrating Class 2 sound level meter is the default choice when you want repeatable measurements around your home. It calculates an equivalent continuous sound level over a selected interval instead of leaving you with a changing instantaneous display.
Class 2 is an instrument classification under IEC 61672, not a promise that every local authority accepts the resulting measurements. Confirm the required instrument class and procedure before buying.
Class 2 meter pros:
- Provides defined measurement functions rather than an unexplained loudness indicator.
- Supports comparisons made with the same settings and microphone position.
- Can be checked with a compatible acoustic calibrator.
Class 2 meter cons:
- Frequency analysis and data export are not included in every model.
- Passing an instrument check does not establish compliance with a local measurement procedure.
Best for: Residents documenting repeated disturbances before seeking a professional assessment.
Ask whether the meter records equivalent continuous levels, stores readings, and accepts the calibrator you intend to use. Read the manual before ordering accessories; microphone size and compatibility matter.
Verdict: Buy an integrating Class 2 meter for repeatable resident-led monitoring when your local requirements permit it.
2. Smartphone app: best for an initial noise check
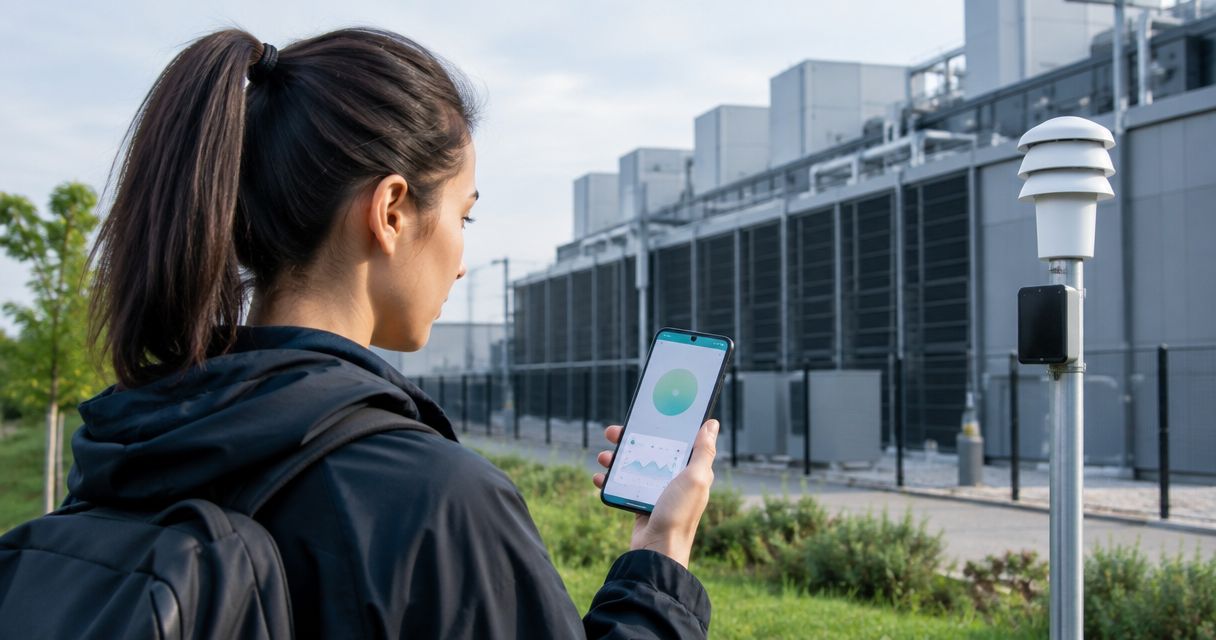
A smartphone sound-level app is a screening tool. Use it to establish when a disturbance occurs and whether further investigation is justified, not to declare a facility in violation.
NIOSH’s Sound Level Meter app for iOS is a named option with publicly documented guidance. Its occupational-noise purpose is distinct from a community noise ordinance; consult that guidance and the local rule separately.
Smartphone app pros:
- Lets you begin observing without assembling a separate measurement kit.
- Makes notes and screenshots convenient during a disturbance.
- Helps you develop a consistent routine before selecting dedicated equipment.
Smartphone app cons:
- A phone’s built-in microphone and processing affect the measurement.
- Results from different phones and apps are not automatically comparable.
Best for: Residents checking whether a recurring sound deserves a more controlled investigation.
Keep the same phone, app, orientation, and position for your screening sessions. Do not combine readings from several devices into one apparent trend without establishing that they measure consistently.
Verdict: Hold off on treating app readings as compliance evidence; use the app to guide your next measurement step.
3. Class 1 meter: best for a professional noise assessment
A Class 1 sound level meter has tighter instrument tolerances than Class 2 under IEC 61672. It belongs in a professional assessment when the governing procedure requires it or the investigation calls for its capabilities.
The instrument is only part of that assessment. Site selection, background sound, operating conditions, and uncertainty still need attention.
Class 1 meter pros:
- Meets a more stringent instrument tolerance class.
- Fits investigations that explicitly require Class 1 equipment.
- Can support a documented measurement chain with compatible calibration equipment.
Class 1 meter cons:
- The class designation does not guarantee every analysis function you need.
- Buying the instrument does not replace expertise in environmental noise assessment.
Best for: Residents or policymakers commissioning an assessment against explicit technical requirements.
For a 2026 professional brief, ask for the measurement procedure, calibration records, site plan, weather record, and treatment of background sound. Request the findings and limitations in plain language.
Verdict: Buy the assessment, not just the instrument, when formal evidence is your objective.
4. Measurement microphone and software: best for investigating hum
A calibrated measurement microphone with suitable analysis software helps show which frequencies contribute to a sound. This is useful when a single overall level does not explain the hum you hear.
The microphone, interface, software, and calibration settings form one measurement chain. A calibration file alone does not make an arbitrary computer setup a standards-compliant sound level meter.
Measurement microphone pros:
- Makes frequency content visible rather than compressing everything into one level.
- Supports investigation of a persistent tone or low-frequency component.
- Lets you compare frequency patterns across documented sessions.
Measurement microphone cons:
- Incorrect input gain or calibration settings undermine absolute level readings.
- A frequency peak does not identify the facility or equipment producing it.
Best for: Residents investigating the character of a hum before commissioning specialist work.
Choose a microphone with a documented response over the frequencies you need to examine. Check how the software handles weighting, averaging, and level calibration before interpreting a graph.
Verdict: Buy for frequency investigation; hold off on attributing a peak to a data center without supporting evidence.
5. Logging meter: best for overnight noise patterns
A logging sound level meter stores measurements over time. It answers a different question from a handheld spot check: when does the sound change, and how long does that pattern persist?
Logging is a capability, not a separate accuracy class. A logging instrument can also be Class 1 or Class 2.
Logging meter pros:
- Preserves time history instead of relying on your memory.
- Captures changes outside the moments you happen to check.
- Supports comparison with a separate weather and event log.
Logging meter cons:
- Traffic, animals, wind, and other events remain part of the record.
- Outdoor deployment requires suitable protection and a documented microphone position.
Best for: Residents documenting recurring nighttime disturbances.
Check storage, export format, power arrangements, and outdoor operating limits. Ensure that the meter’s clock matches your written log; a time mismatch makes event interpretation harder.
Verdict: Buy logging capability when timing and persistence matter more than isolated readings.
6. Audio recorder: best for documenting audible context
An audio recorder preserves what a disturbance sounded like at a particular time and place. Pair the recording with a written log describing your location and nearby events.
Playback is not a calibrated reproduction of the original sound level. Recording gain, microphone response, compression, and playback equipment all affect what a listener hears.
Audio recorder pros:
- Preserves context that a sound-level number cannot describe.
- Helps distinguish observed events when reviewing a measurement log.
- Gives a professional assessor material for an initial discussion.
Audio recorder cons:
- Automatic gain control can change apparent loudness during a recording.
- Recordings can capture private conversations or other sensitive information.
Best for: Residents explaining the character and timing of a disturbance.
Record from your own property or another lawful location. Avoid collecting conversations, and retain the original file rather than submitting only an edited excerpt.
Verdict: Buy only for supporting context; skip an audio recorder as your sole sound-level measurement tool.
What the numbers actually mean
Decibels describe a logarithmic level. A 10 dB increase represents ten times the sound intensity, not ten times the perceived loudness. A change of approximately 3 dB represents twice the sound intensity; neither relationship establishes how a particular resident experiences a disturbance.
A-weighting reduces the contribution of low frequencies to the reported level. C-weighting reduces that contribution less, while Z-weighting is nominally flat over its specified range. A low A-weighted reading alone does not settle a complaint about low-frequency hum.
An acoustic calibrator commonly provides a 94 dB signal at 1 kHz. Use the actual level, frequency, compatibility requirements, and corrections stated in your calibrator’s documentation; that common signal is not universal.
The relevant technical references have different scopes: IEC 61672 addresses sound level meters, IEC 60942 addresses sound calibrators, and IEC 61260 addresses octave-band and fractional-octave-band filters. For 2026 community monitoring, these references explain equipment requirements; the applicable local rule determines which measurements matter.
Build a repeatable measurement record
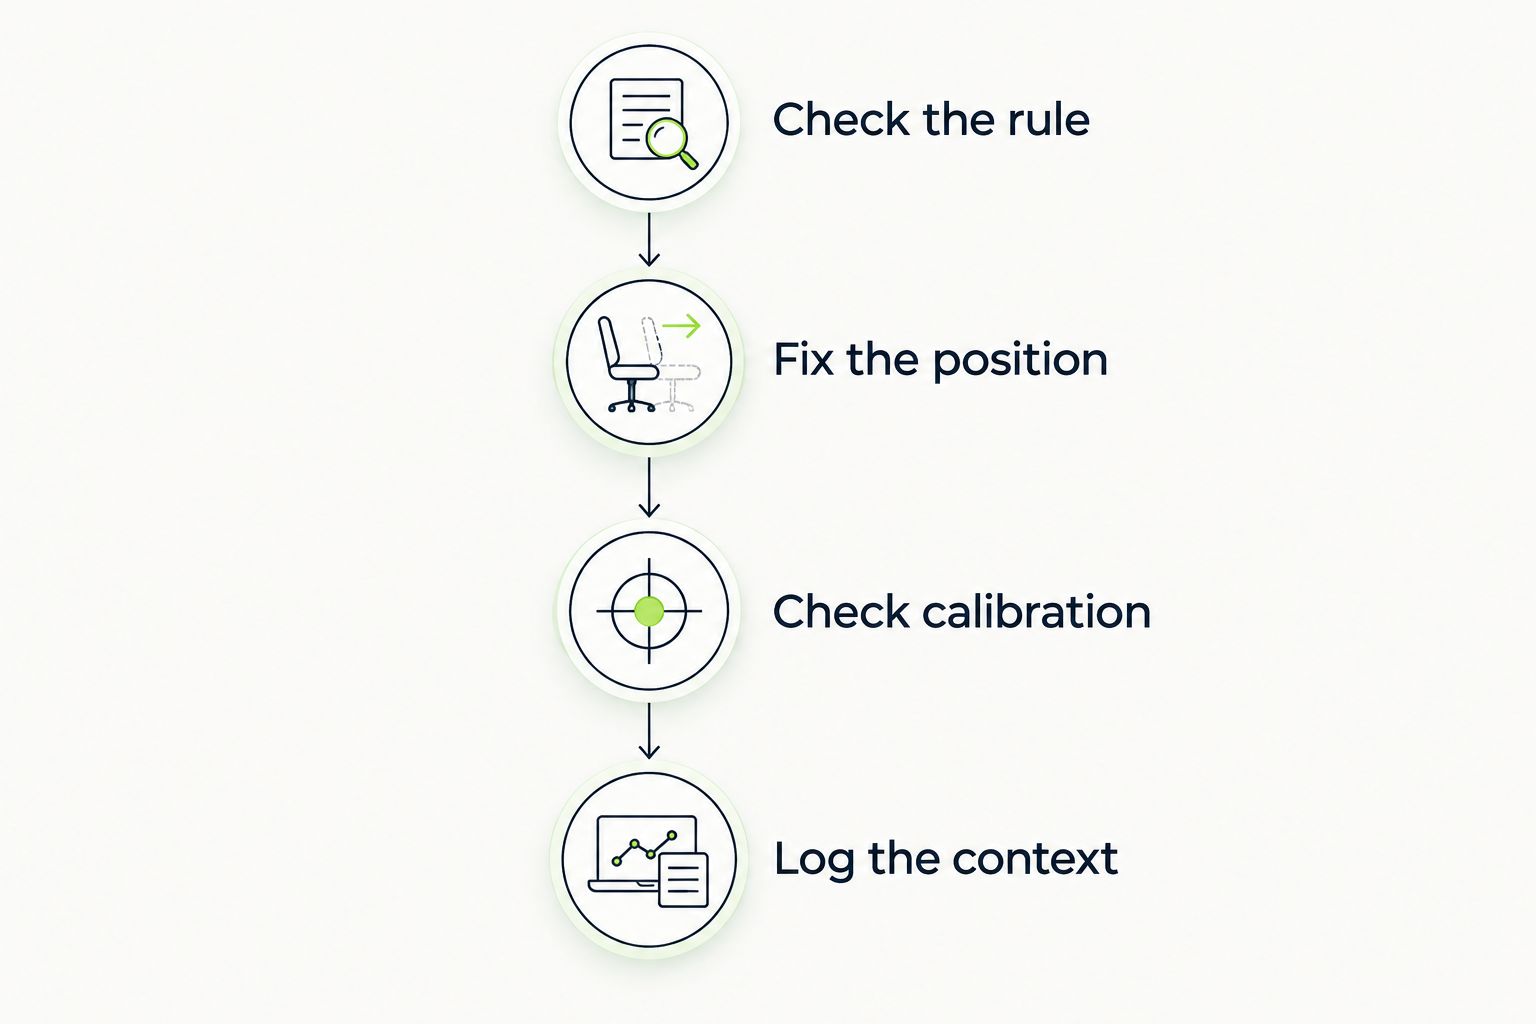
A useful record lets another person understand what you measured and repeat the procedure. DYORUSA’s data center noise guidance starts with that distinction: an observation is evidence of an observation, not automatic proof of its cause.
- Check the rule. Identify the required location, time period, measurement settings, and instrument requirements before collecting compliance-oriented readings.
- Fix the position. Document microphone height, orientation, and nearby surfaces. Do not compare a bedroom reading with a property-line reading as though the locations were interchangeable.
- Check calibration. Follow the equipment instructions for checks before and after the session. Preserve the results.
- Log the context. Record weather, nearby traffic, other audible events, start and finish times, and the settings used. Retain original exports and recordings.
The sequence prevents a common mistake: collecting a large amount of data before deciding what question it needs to answer.
How we ranked these tools
This 2026 ranking prioritizes repeatable measurements, understandable records, and a clear match between the tool and the question. It is a capability-based buying guide, not a hands-on model comparison.
The integrating Class 2 meter ranks first for resident-led monitoring. The other tools serve distinct tasks: screening, formal assessment, frequency investigation, overnight logging, and audible documentation. No tool receives credit for identifying a noise source from a level reading alone.
Which noise measurement tool should you choose?
Choose an integrating Class 2 meter as the default for repeatable home monitoring, after checking local requirements. Add logging if overnight patterns are your concern; seek frequency analysis if a hum remains unexplained by overall levels.
Start with a phone app if you are still establishing the disturbance’s timing. Commission an acoustics professional when your objective is formal assessment rather than personal observation.
FAQ
What’s the best tool to measure data center noise at home?
An integrating Class 2 sound level meter is the default choice for repeatable resident-led monitoring. Check local requirements before using its readings as compliance evidence.
Can I measure data center noise with my phone?
You can use a smartphone sound-level app for initial screening. Phone microphones and processing affect readings, so app results do not automatically establish a violation.
Is a Class 1 meter better than a Class 2 meter?
Class 1 meters have tighter instrument tolerances under IEC 61672. Choose the class required by the measurement procedure; correct setup and interpretation remain essential.
What tool should I use to investigate a low-frequency hum?
Use equipment with suitable frequency analysis and a documented microphone response. An overall A-weighted reading alone does not characterize the frequency content of a hum.
Does a loud reading prove the data center caused the noise?
No. A sound-level reading measures sound at the microphone, not its source. Source attribution needs supporting investigation and consideration of other sound sources.
Can an audio recording prove how loud the noise was?
An ordinary audio recording does not establish a calibrated sound level. It is useful for documenting audible character and timing alongside measurements and a written log.
What should I record with my noise readings?
Record the location, microphone position, settings, times, weather, calibration checks, and other audible events. Preserve original files so another person can examine the measurement context.
One last thing
The largest reading is not necessarily the most useful reading. A passing vehicle or gust of wind can dominate a maximum while telling you little about a persistent disturbance.
Before submitting a 2026 complaint, check that each highlighted result matches the location, averaging period, and measurement type the authority actually uses. A well-documented relevant reading is more useful than an unexplained screenshot.